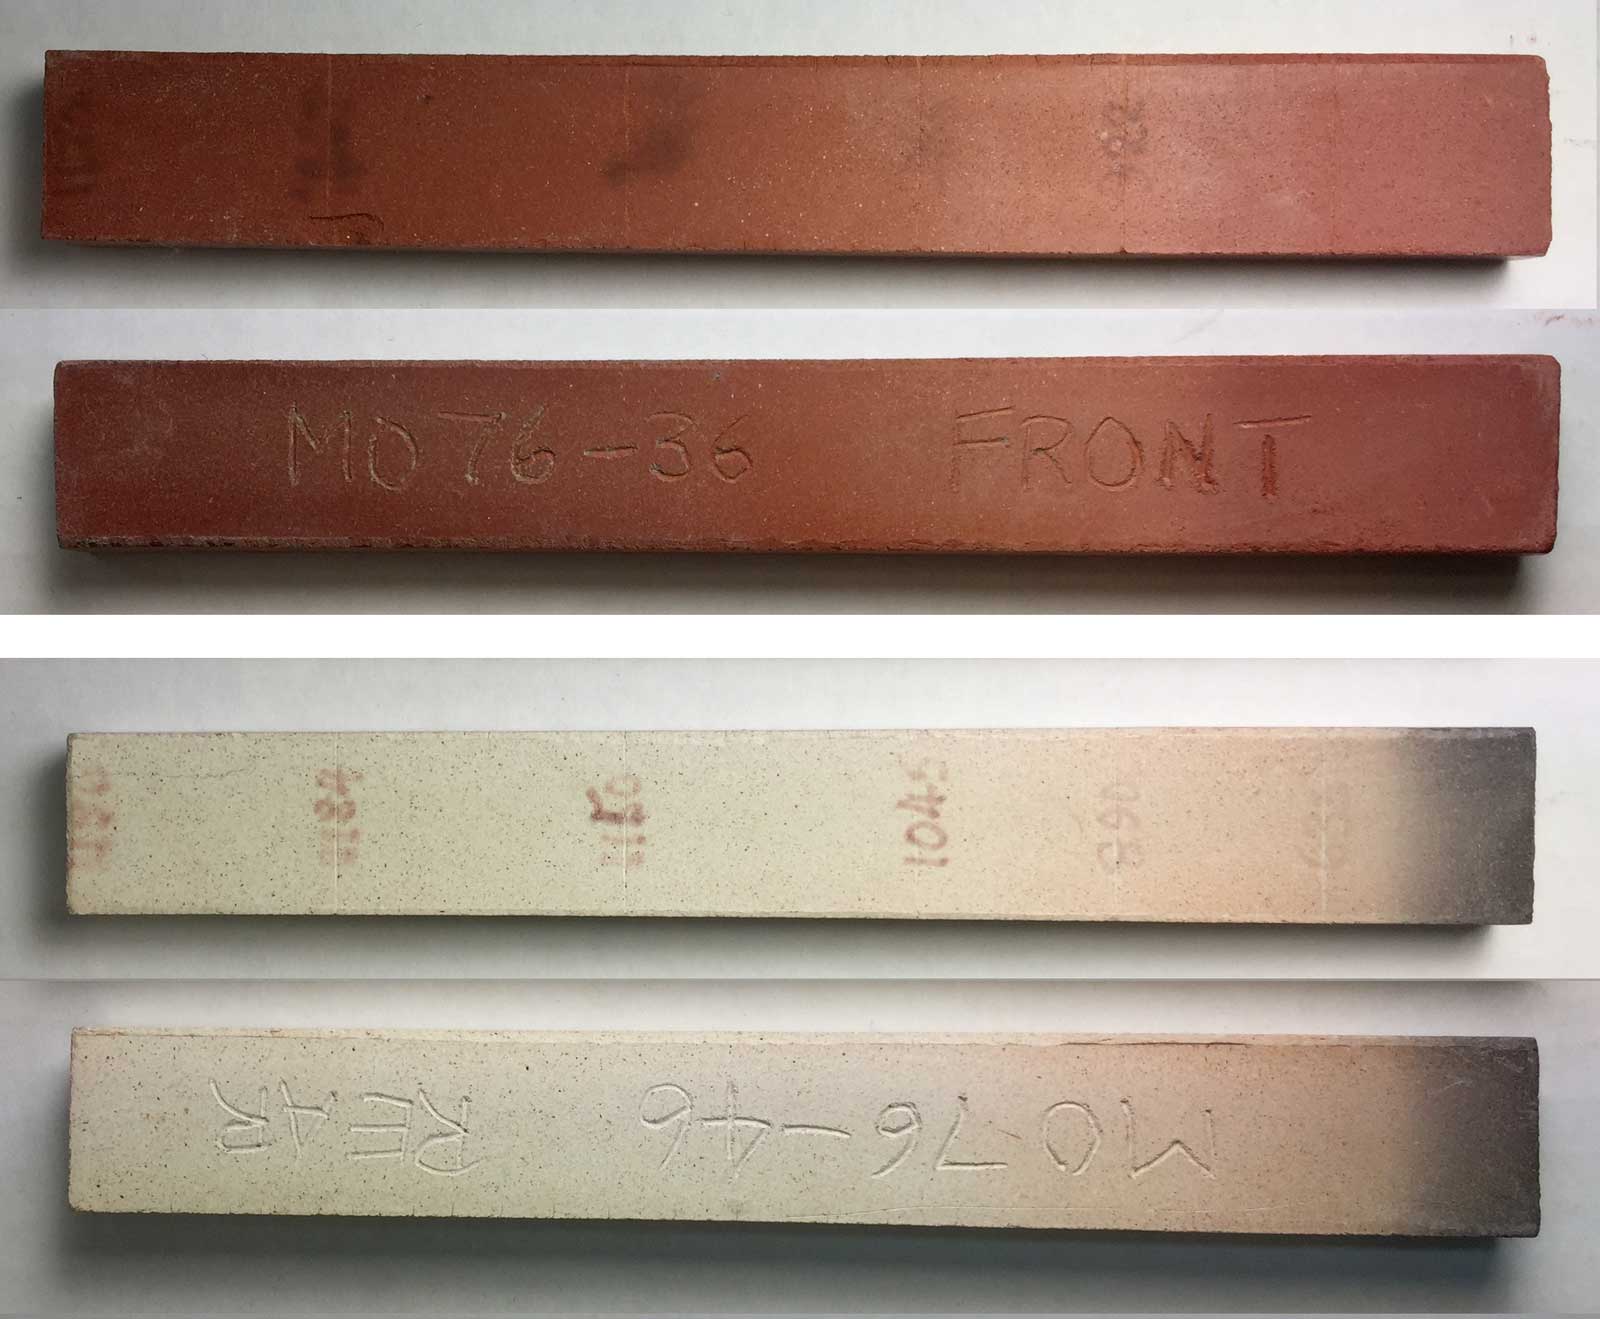
Gradient test bars show how a range of temperatures affects a clay
These are the fronts and backs of dust-pressed and fired gradient bars. They were done by Luke Lindoe in the I-XL brick lab to assess the firing history on two clay samples from Montana. After final drying, the bar width at each line is carefully recorded. They are fired horizontally in a furnace capable of reproducing linear thermal gradients along the length of the bar (equally spaced insight-live.com/picture/3125">thermocouples enable control in each micro-zone). After firing, the widths are re-measured. The data produces a graph of fired shrinkage vs. temperature. Bars can also be visually inspected side-by-side for differences (color being the most obvious but also surface character). This method of comparatively assessing the effect of temperature on a clay test bar is popular in the brick industry (e.g. when a new mining of clay is being compared with a previous one). However, the SHAB test, although requiring more effort, provides more information and is more accurate (e.g. for pottery and porcelain).
Pages that reference this post in the Digitalfire Reference Library:
Luke Lindoe in 1971, Orton Thermal Gradient Furnace PDF brochure, Orton Gradient Furnaces, Maturity, Firing Shrinkage, Brick Making

This post is one of thousands found in the Digitalfire Reference Database. Most are part of a timeline maintained by Tony Hansen. You can search that timeline on the home page of digitalfire.com.
