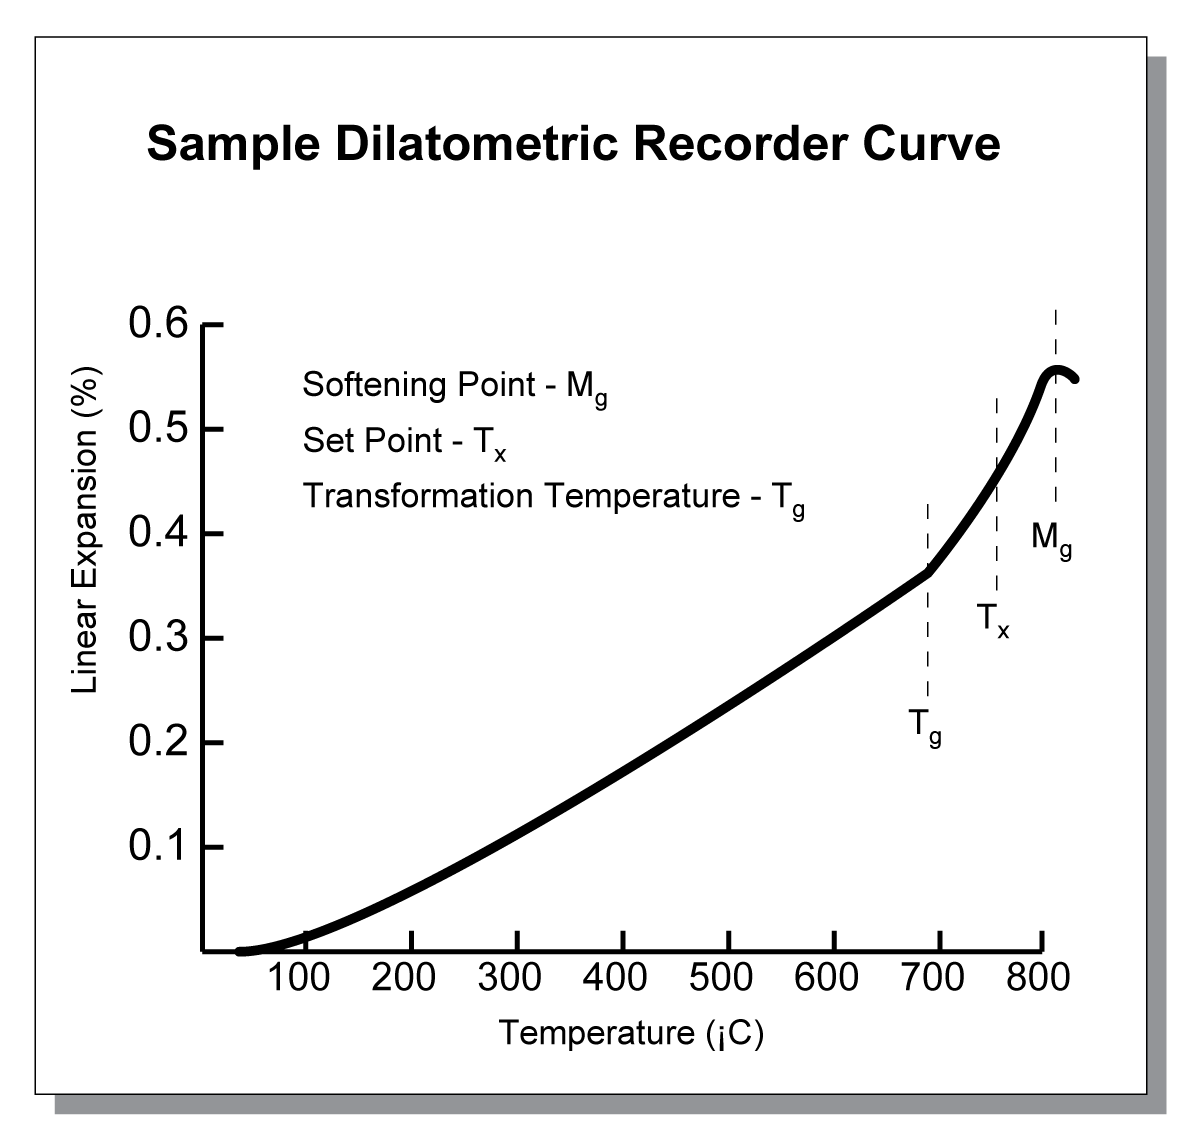
Simple dilatometric curve produced by a dilatometer
Dialometric chart produced by a dilatometer. The curve represents the increase in insight-live.com/glossary/18">thermal expansion that occurs as a glass is heated. Changes in the direction of the curve are interpreted as the transformation (or transition) temperature, set point and softening point (often quoted on frit data sheets). When the thermal expansion of a material is quoted as one number (on a data sheet), it is derived from this chart. Since the chart is almost never a straight line one can appreciate that the number is only an approximation of the thermal expansion profile of the material.
Pages that reference this post in the Digitalfire Reference Library:
COLE Co-efficient of Linear Expansion, GTTM Glass Transition Temperature, GSPT Frit Softening Point, Dilatometer curve of vitreous porcelain (red) vs. stoneware body, Glaze fit, Co-efficient of Thermal Expansion

This post is one of thousands found in the Digitalfire Reference Database. Most are part of a timeline maintained by Tony Hansen. You can search that timeline on the home page of digitalfire.com.
